
Discover dataflow mapping from your codebase.
Every personal-data field, followed from the line that touches it to the log, store or third party it reaches. Read out of the repository, not out of a workshop.
Every field your code touches, mapped to where it lands.
Inside the product the same view is live: hover a node to trace its flows, click a sink to land on the file and line.
A map drawn by hand is out of date the day it is signed.
Someone asks the team where the data goes. The team answers from memory, about the parts they wrote, as of the last time they looked.
The map is a document. The system is not. Every release moves them further apart and nothing tells you by how much.
The paths that matter are the ones nobody would think to mention: a debug log, a retry payload, a vendor SDK doing its own collection.
Who enters data, what processes it, where it lands.
Code-level touchpoints are collapsed into the architecture they describe, so the map is small enough to reason about and every box still drills back to the line it came from.
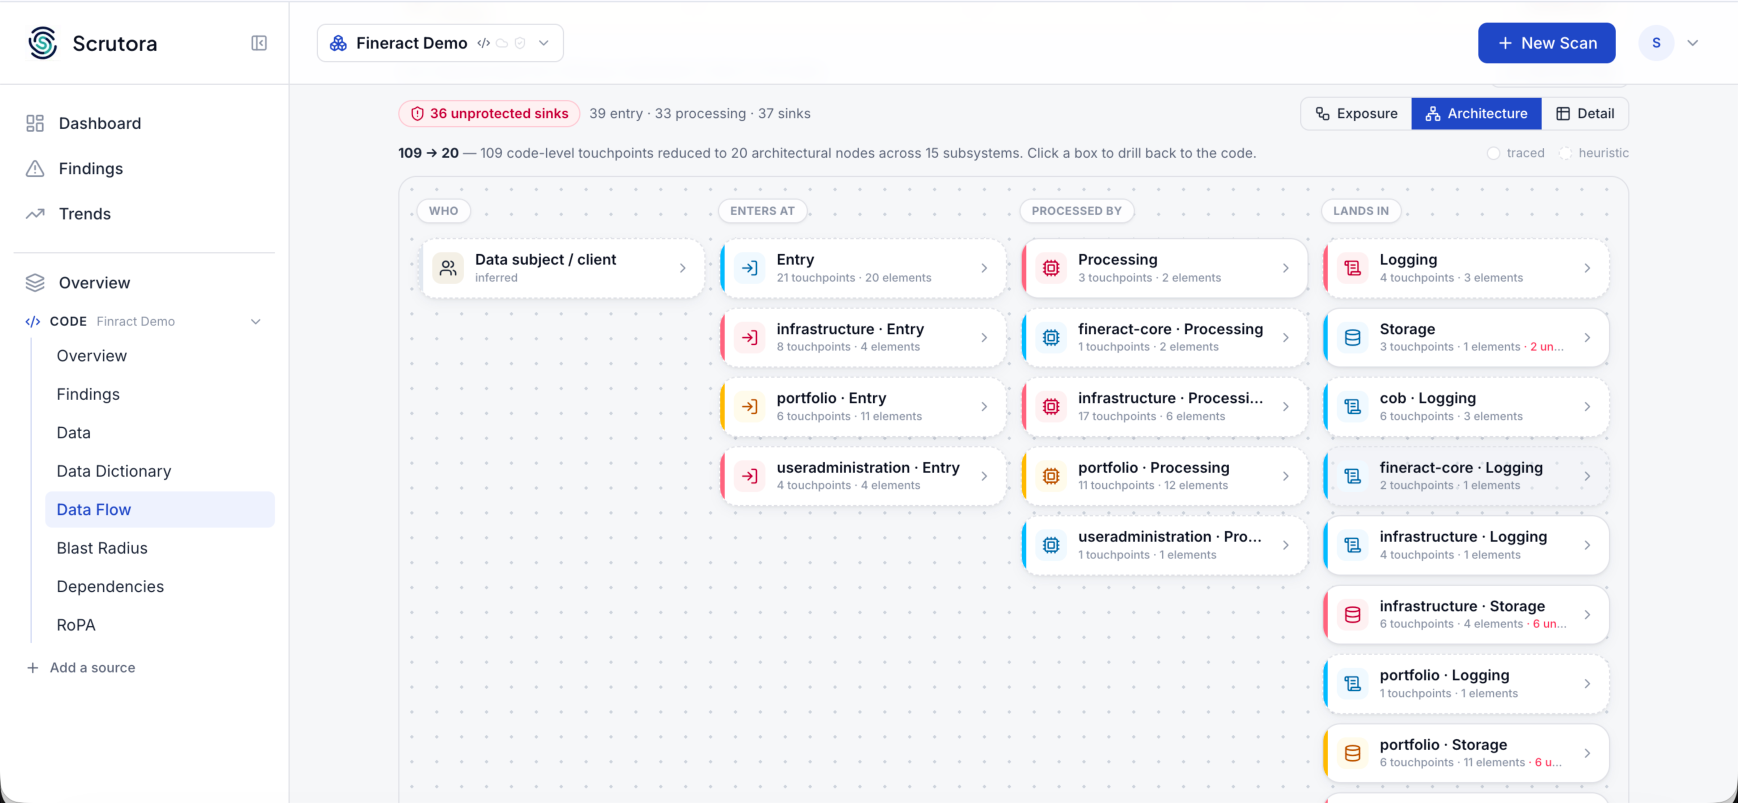
Every location, every hop, every recipient.
Go granular: see the details of a dataflow at the field level.
Data flows to different stores. Can you fulfil a deletion request if you did not know the data was flowing to an embedding store?
Dataflow Designer
Start from what the scan found. Add the systems it could not see: vendors, internal services, anything outside the repository, directly on the canvas.
Anything you add by hand, including the vendors and COTS systems that were never in the repository, flows into the Record of Processing with everything the scan found.
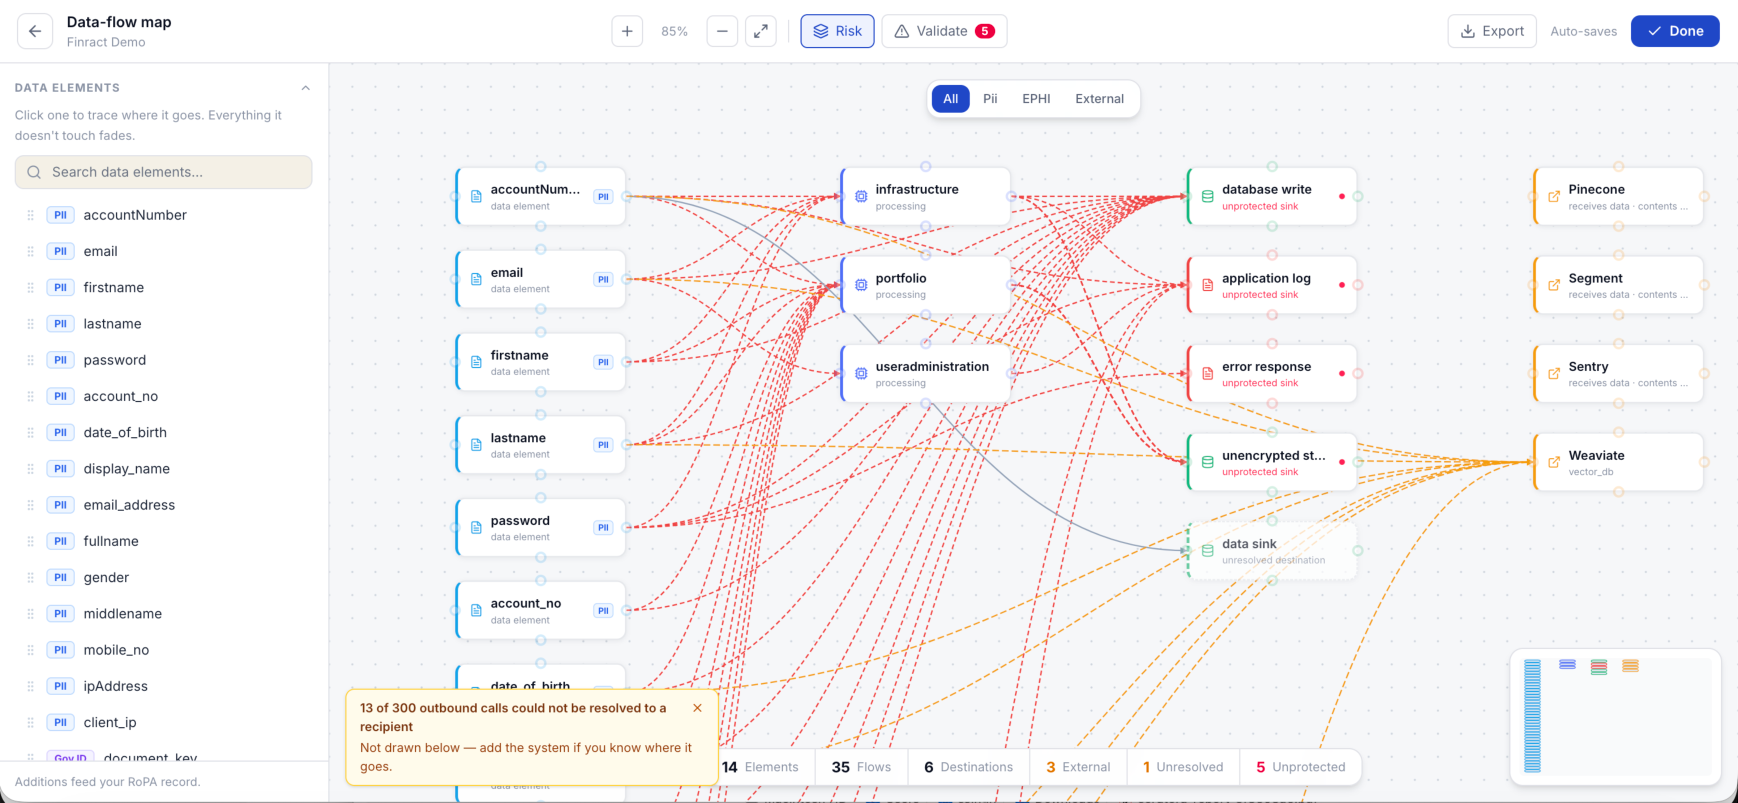
Discover your dataflow.
Scan a public repository. We do not store your code: we process it to generate the findings, then discard it. We will give you this in writing.
Want to run it locally in your IDE? Check out our integrations.